The regressive season
Early indications suggest that water charges and residential property charges will not be progressive, and will disproportionately hit those on low and average incomes. By Michael Taft.
Following on from the Household Charge debacle the Government intends to introduce (a) water meter installation charges, (b) water metering charges, (c) residential property charges. This is a heavy agenda of new charges and taxes. Here I just want to explore how ‘fair’ these charges and taxes are likely to be, with what little information we have at hand. By ‘fair’, I mean how progressive they are likely to be. Early indications are that they will not be progressive, and that they will disproportionately hit those on low and average incomes.
Regressive taxation seems to be all the rage these days. Let’s look at the last two budgets.
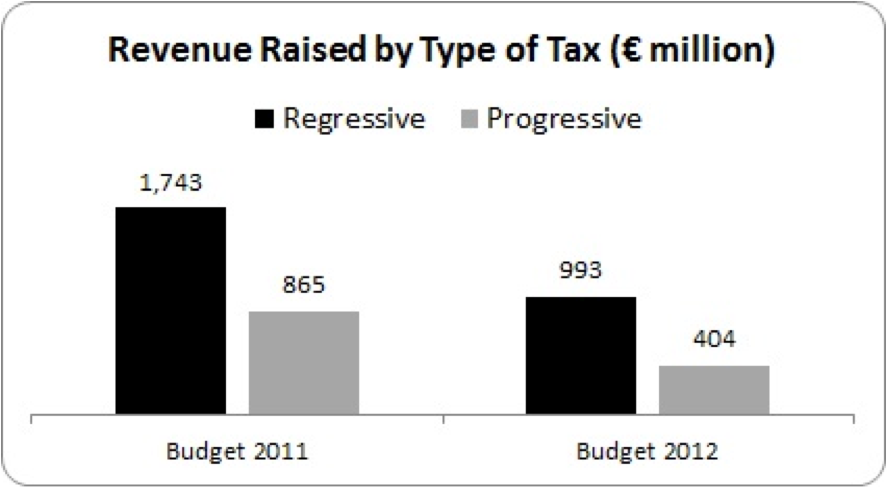
Regressive taxation made up approximately two-thirds of all taxation raised. In Budget 2011, regressive taxes include reduction in personal tax credits, the Universal Social Charge and excise taxes. I have also included the reduction of the standard rate tax band; though the low-paid weren’t affected by this, it had a disproportionate impact on average income earners. In Budget 2012, regressive measures included the VAT rise, Household Charge and carbon taxes (while the latter has positive environmental benefits, the ESRI called for social welfare increases alongside carbon tax increases – which didn’t happen).
So what can we expect from water metering charges and property taxes?
Water Charges
User charges for universal services (water, refuse, etc.) are, by their very nature, regressive unless there is some mitigating instrument. Here are two pieces of evidence. The first is the impact of refuse charges, which is a universal service.
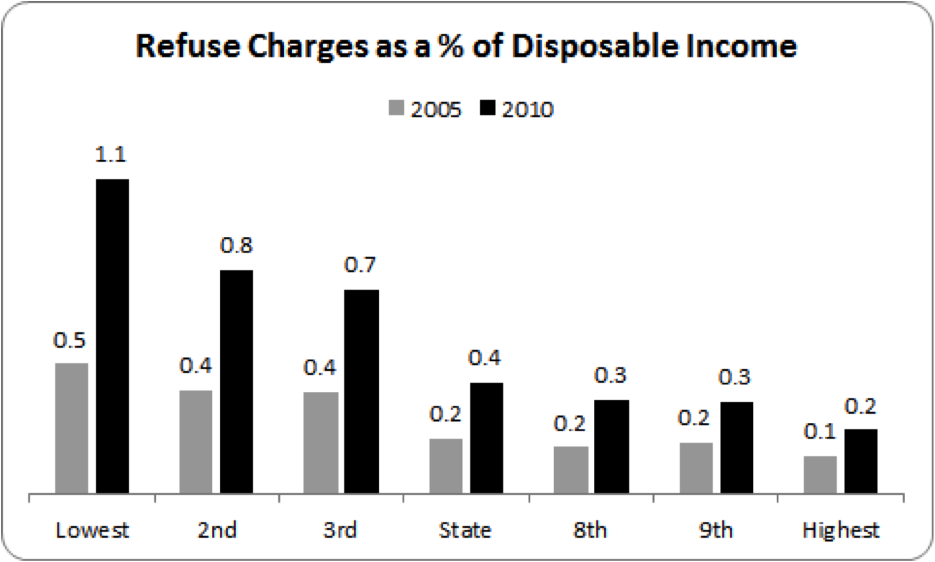
According to the Household Budget Surveys – from 2005 and 2010 – refuse charges were more of a burden among the lowest income groups. One small caveat: the 2010 HBS includes ‘skip hire’ in refuse charges. This is not likely to have substantially altered the numbers. Both surveys show that the lowest income groups paid five times more than the highest income groups.
What can we expect from water charges? Here are some numbers from the comprehensive OECD study on the distributional impact of water charges:
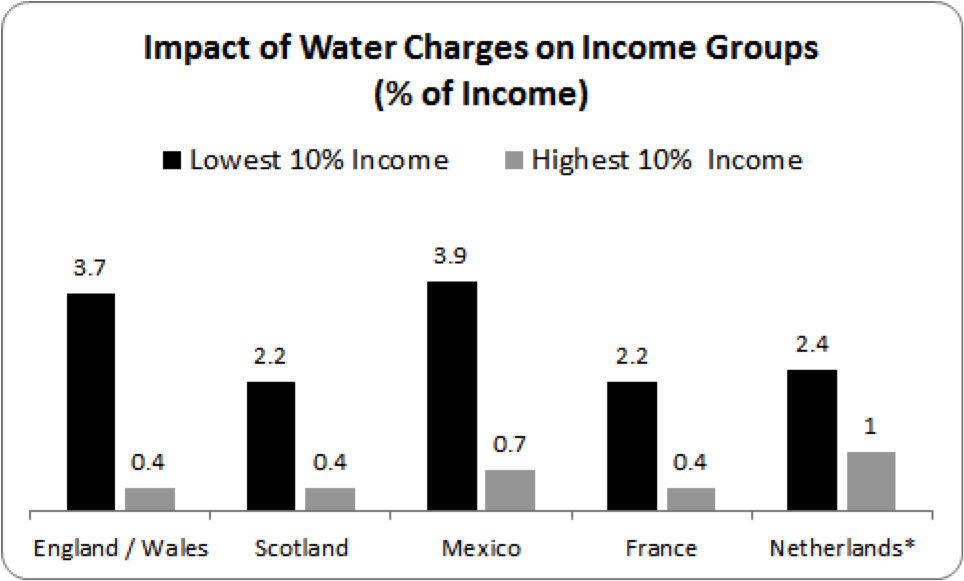
The impact of water charges is deeply regressive. In the case of Netherlands, the ratio is between the top and bottom 20% – which probably underestimates the regressive impact between the top and bottom deciles.
The Government will no doubt claim that the ‘free water allowance’ will help ameliorate this regressive impact. It might, but if the experience of the Flanders-type free allowance scheme is any guide (Table 3.1 as shown in the report), the ratio of ‘rich-poor’ water bills will shrink only slightly.
The impact of water charges will be regressive. How regressive will depend on the design of the scheme. Not every tax need be progressive. For instance, the Exchequer’s biggest earner is VAT – one of the more regressive taxes. One has to look at the total tax package.
But one also has to examine the context. After two highly regressive tax budgets, with real wages falling and no signal that social protection rates will be increased in the near future, with unemployment high and households deeply in debt – to impose a tax/charge that disproportionately hits low/average income earners will contribute to further stagnation and social inequity.
Residential Property Taxation
Property taxation, by its very nature, should be progressive. There is a relationship between property and income – although this can be uneven. But again much depends on the design of the tax and, here, we find a problem. For not all property will be taxed. Only housing assets will be taxed; financial assets or property will be exempt. Given that financial property (cash, equity, pension/insurance reserves) make up between 40 and 50% of all property in the state; and given that most financial property is held by the top income groups – to exempt financial property already begins to skew the new property tax regime in favour of high earners.
That being said, would a residential property tax regime be progressive? The evidence is mixed. Let’s look at the distributional impact of the ESRI’s property tax model. The ESRI designed a property tax based on the following:
- Income earners below €15,000 are exempt
- The rebate is withdrawn at the rate of 20 cent in the euro on income above the exemption limit – thus the “rebate withdrawal rate” or “marginal relief rate” is 20%.
- Property is taxed at 0.4% of market value
So how will it impact on different income groups?
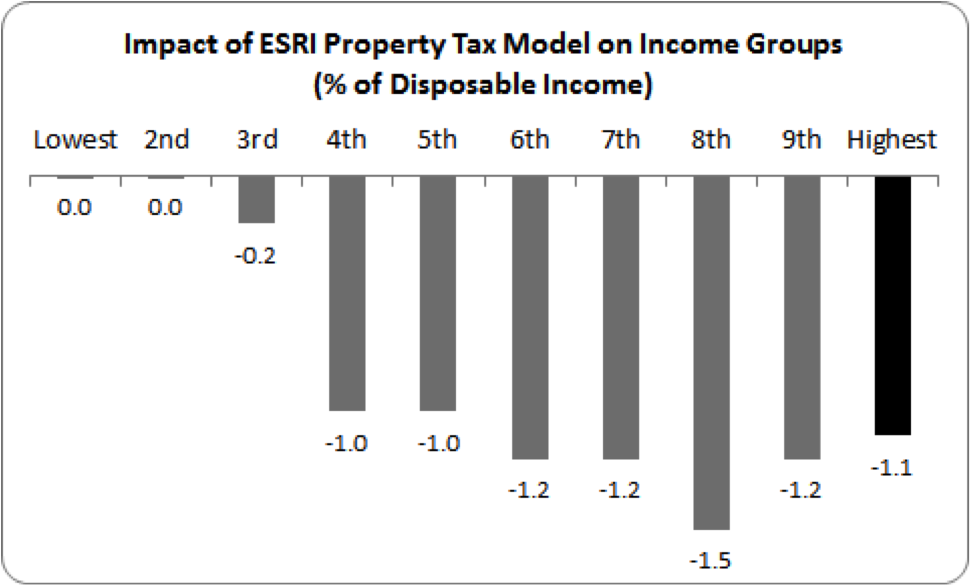
There is a progressivity of sorts – but only of sorts. The lowest 30% of households are effectively exempt. However, once households absorb the full impact of the property tax, the 6th to 9th decile households experience a higher take than the highest 10% earners. Indeed, it is the 8th decile that suffers the highest take of all. While the ESRI uses an equivalised income scale (taking into account adults and children in the household), according to the latest CSO Income and Living Conditions survey (2010), the average disposable income in the 8th decile is €55,000 per year for an average of 3 people in the house. This is hardly ‘rich’.
But there’s another way to measure this – the property tax as a percentage of discretionary disposable income. What this takes into account is the cost of food, housing and light & fuel. These are relatively fixed costs which households have little influence over. Using the Household Budget Survey’s data on these costs and disposable income, a more concerning picture emerges:
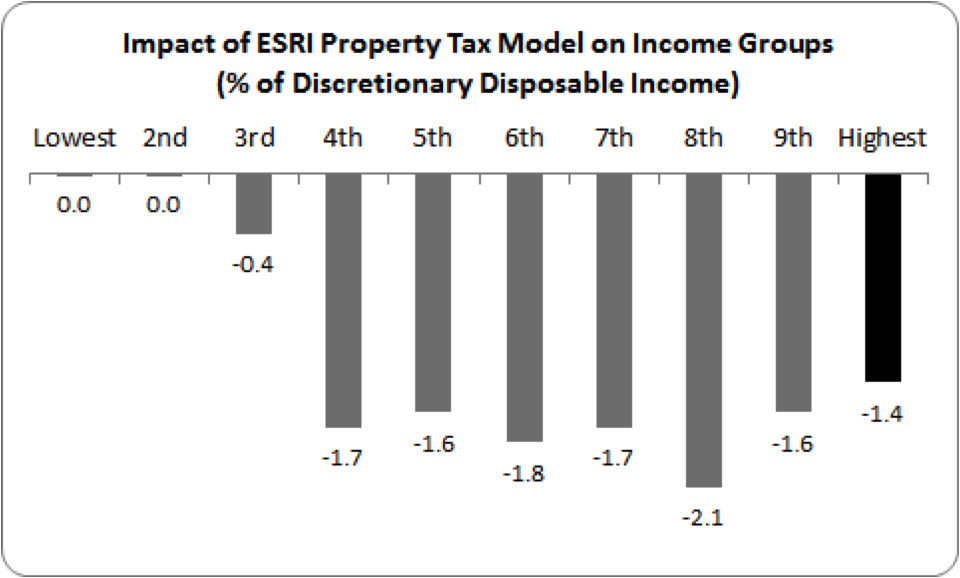
From the 4th decile onwards, the property tax could hardly be called ‘progressive’. The highest earners pay the lowest level of tax.
We have to be careful about this calculation. There is a bit of apples and oranges about this as the ESRI bases its impact on their SWITCH model using equivalised income whereas the above uses the Household Budget Survey.
So while this should be seen as indicative only, it should be noted that I have only included a limited amount of necessary expenditure. It excludes things like clothing and footwear, personal hygiene, non-durables, transport etc.
* * *
None of this should be taken as grounds for opposing a property tax or even water metering charges (though the latter is particularly problematic). What this emphasises is both the design of such taxes; and just as important, data on the impact of households. Just asserting that a property tax is ‘progressive’ or that a free water allowance will ‘protect the lowest incomes’ is simply not good enough. There needs to be concrete analysis based on comprehensive surveys. This is all do-able if the Government wants to do this.
So for opposition TDs and backbench Labour TDs who are concerned with equity and economic efficiency, it is imperative that they demand of Government an evidence-based policy. Until the evidence is presented, property taxes and water-metering charging should be opposed.
For the last thing the economy needs is more inefficient and socially inequitable taxation. {jathumbnailoff}
Image top: remediate.this.